

An essential component of any e-commerce business is performance analysis. Knowing which metrics to track can help you identify weak areas in your operations. With this data in hand, you can then make the necessary adjustments to boost your conversions.
In this post, we’ll take a closer look at e-commerce metrics and why you should track them. Then, we’ll list some of the most important data points, and show you how to calculate them. Let’s get started!
What Are E-Commerce Metrics? (And Why You Should Track Them)
When you launch an online store or business, you’ll want to start collecting data on its performance. These e-commerce metrics can shed light on your customers’ behavior, like what they’re buying, the size of their orders, and whether they come back for additional purchases.
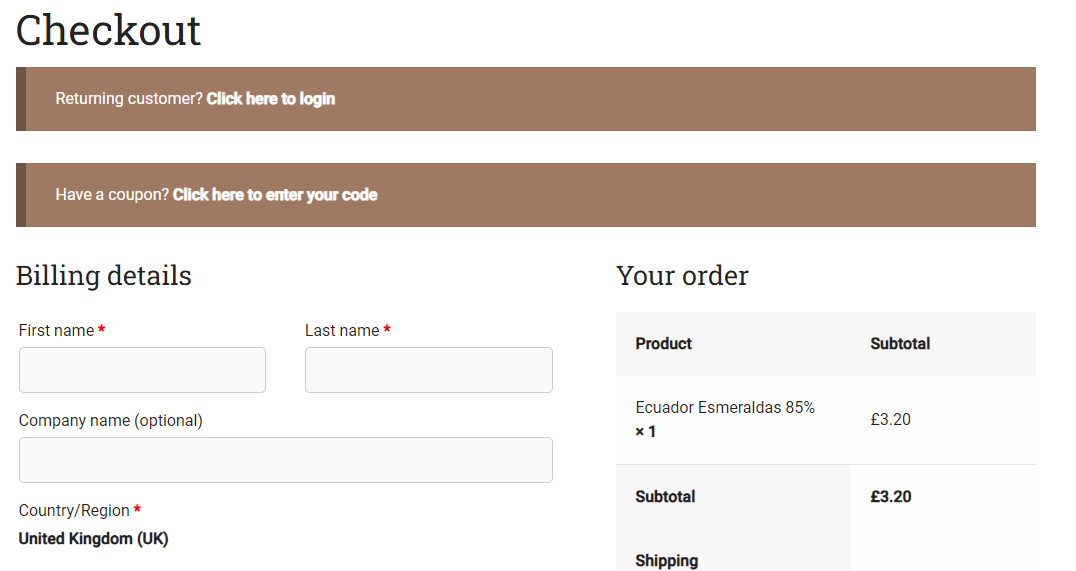
When you have access to this valuable data, you’ll be able to improve your website and optimize your marketing strategies. For instance, if you find that many shoppers are leaving items in their carts, you might need to redesign your checkout page so that it’s more user-friendly:

Similarly, if only a few shoppers are returning to your store, you may need to create a marketing campaign to draw them back in. For example, you might create a discount or loyalty program.
Additionally, these metrics can help your business create quantifiable key performance indicators (KPIs). With the data at your fingertips, you’ll be able to include tangible targets and goals, like reduced cart abandonment rates, increased average order values, and more.
7 E-Commerce Metrics to Track
Now, let’s look at the most important e-commerce metrics for online stores and other e-commerce sites.
1. Conversion rate
You may already be familiar with conversion rates. This metric measures the percentage of website visitors who complete a desired action, like making a purchase.
Calculating your conversion rate is quite simple. If you’re using WordPress and plugins like Jetpack, you should be able to see the number of visitors within your dashboard:
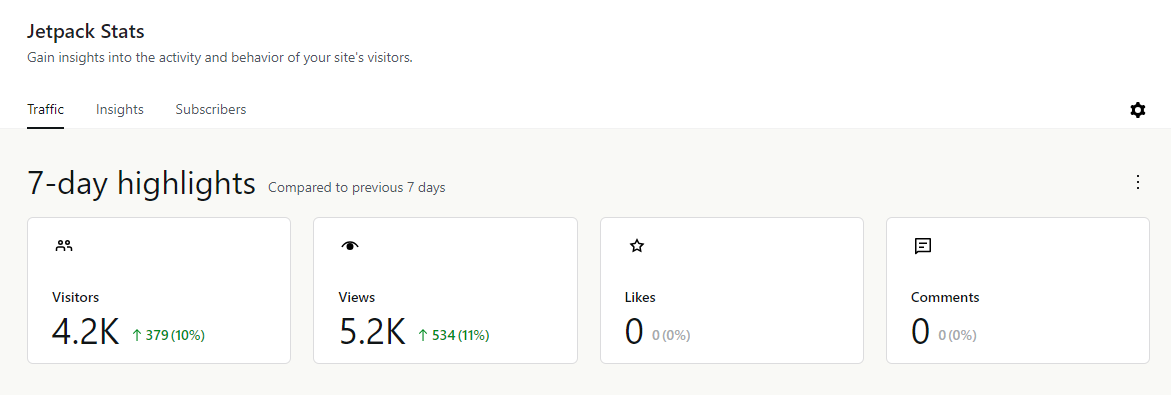
Plus, if you have a WooCommerce store, you’ll get access to a variety of analytics, including the number of orders in a given period.
To work out the conversion, you’ll need to divide the number of conversions (like orders) by the total number of visitors. Then, multiply the result by 100 to get the percentage.
So, if your website had 1,000 visitors in a month and 50 of them made a purchase within that period, the conversion rate would be 5%.
In 2023, the average conversion rate for e-commerce businesses worldwide was 2.5%. If yours is a lot lower than this, it may be time to boost your marketing efforts.
2. Average Order Value
As the name suggests, the average order value (AOV) refers to the amount of money spent at your store by each customer. For instance, on average, shoppers may spend $50 on each order.
To calculate your AOV, you’ll simply need to divide the total revenue by the number of orders. So, if last month you made $10,000 and you had 200 orders, the AOV would be $50.
If your AOV is less than ideal, you can implement incentives to encourage shoppers to spend more at your store. For example, they may be eligible for free shipping and discounts when they spend over a certain amount.
3. Customer Lifetime Value
If you prioritize client retention or have a loyalty program, you’ll also want to track your customer lifetime value (CLV). This e-commerce metric refers to the predicted revenue that a customer will generate throughout their relationship with your business.
To calculate the CLV, you’ll first need to multiply the average order value by the average purchase frequency. The average purchase frequency is the number of purchases divided by the number of customers.
The next step is to multiply the result by the customer lifespan. This lifespan is easier to determine if you have a loyalty program or subscription service. For example, on average customers might subscribe to your services for 12 months.
So, if the average purchase value is $50, the average purchase frequency is 2 times per month, and the customer lifespan is 12 months, the CLV would be $1,200.
4. Customer Acquisition Cost
The customer acquisition cost (CAC) shows you how much money you spend on gaining a new customer. This metric takes into account your marketing expenses and onboarding costs.
The CAC is very important, as it indicates whether you’re making a profit. If the costs of acquiring a new customer are higher than the generated revenue per customer (the CLV), then you might be operating at a loss.
This metric can be calculated by dividing the total marketing and sales expenses by the number of new customers acquired in a specified time period. For instance, if you spent $10,000 on marketing efforts in a month and acquired 100 new customers, the CAC would be $100.
5. Retention Rate
The retention rate measures the percentage of customers that make repeat purchases from your store. To work it out, you’ll first need to specify a period of time (i.e. one month).
Then, find out the number of customers at the end of that period, and subtract the number of new customers within that same period. Next, divide the result by the number of customers you had at the start of the period, and multiply the result by 100.
So, if you had 500 customers at the beginning of the month, obtained 100 new customers, and ended the month with 550 customers, the retention rate would be 90%.
If the retention rate is lower than you’d hoped, you may need to step up your marketing game or start a loyalty program:

For instance, giving repeat customers free gifts or exclusive discounts can help you increase this rate.
6. Churn Rate
Churn rate is an e-commerce metric that you’ll want to keep as low as possible. It’s the percentage of customers who stop using your product or service within a given period.
To find out your churn rate, deduct the number of customers lost during a specific period by the number of customers at the beginning of that period. Then, multiply the result by 100.
For example, if you started the month with 500 customers and lost 50 customers by the end of the month, the churn rate would be 10%.
This metric is particularly important for subscription-based businesses. If you have a high churn rate, then many customers are losing interest in your service or product, or they no longer find it useful.
7. Cart Abandonment Rate
Finally, let’s look at the cart abandonment rate. This is the percentage of people who leave items in their carts and choose not proceed with a purchase.
You can work this out by dividing the number of abandoned carts by the number of initiated checkouts. As always, you’ll need to multiply the result by 100.
For instance, if there were 200 initiated checkouts and 50 carts were abandoned, then the cart abandonment rate would be 25%.
This metric can pinpoint areas of friction in the shopping process. For example, a high cart abandonment rate may indicate that there’s something wrong with the checkout page. Perhaps it’s too complicated or doesn’t offer a variety of payment methods.
Conclusion
Tracking important e-commerce metrics enables you to identify problems in your marketing strategies and website design. This way, you can more effectively drive conversions. For instance, you’ll want to make sure that the customer acquisition cost is lower than the customer lifetime value, and that the churn and abandonment rates are as low as possible.
Do you have any questions about the e-commerce metrics we discussed in this post? Let us know in the comments section below!
Featured image: Austin Distel.